Call Observability Demo
Deployment
Each deployment generates a unique ID. View logs in the console.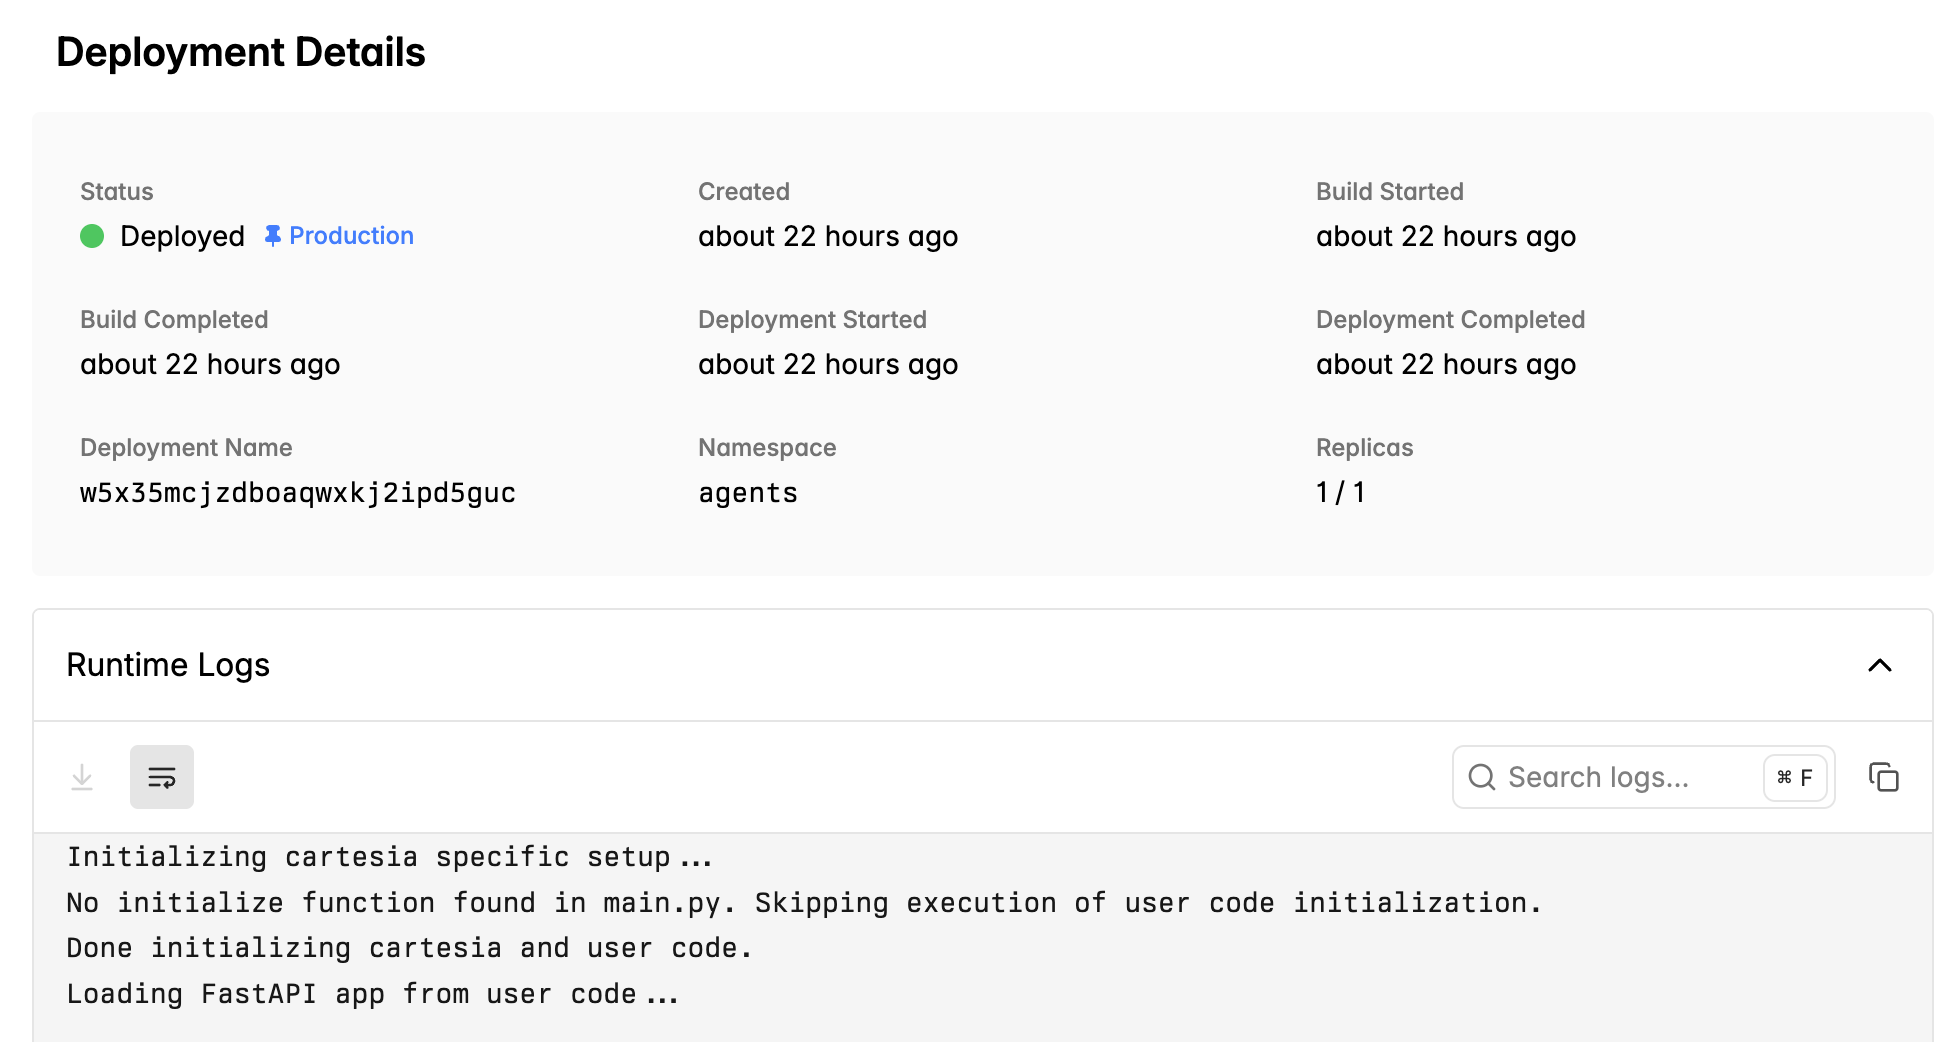
Call Logs
You can click into a call and view any logging statements generated by your reasoning code.Call Logs
Transcripts
Each call has a transcript with independently separated transcribed audio and text to be generated. When you export these transcripts with the API or CLI, these include more granular turn level timestamps.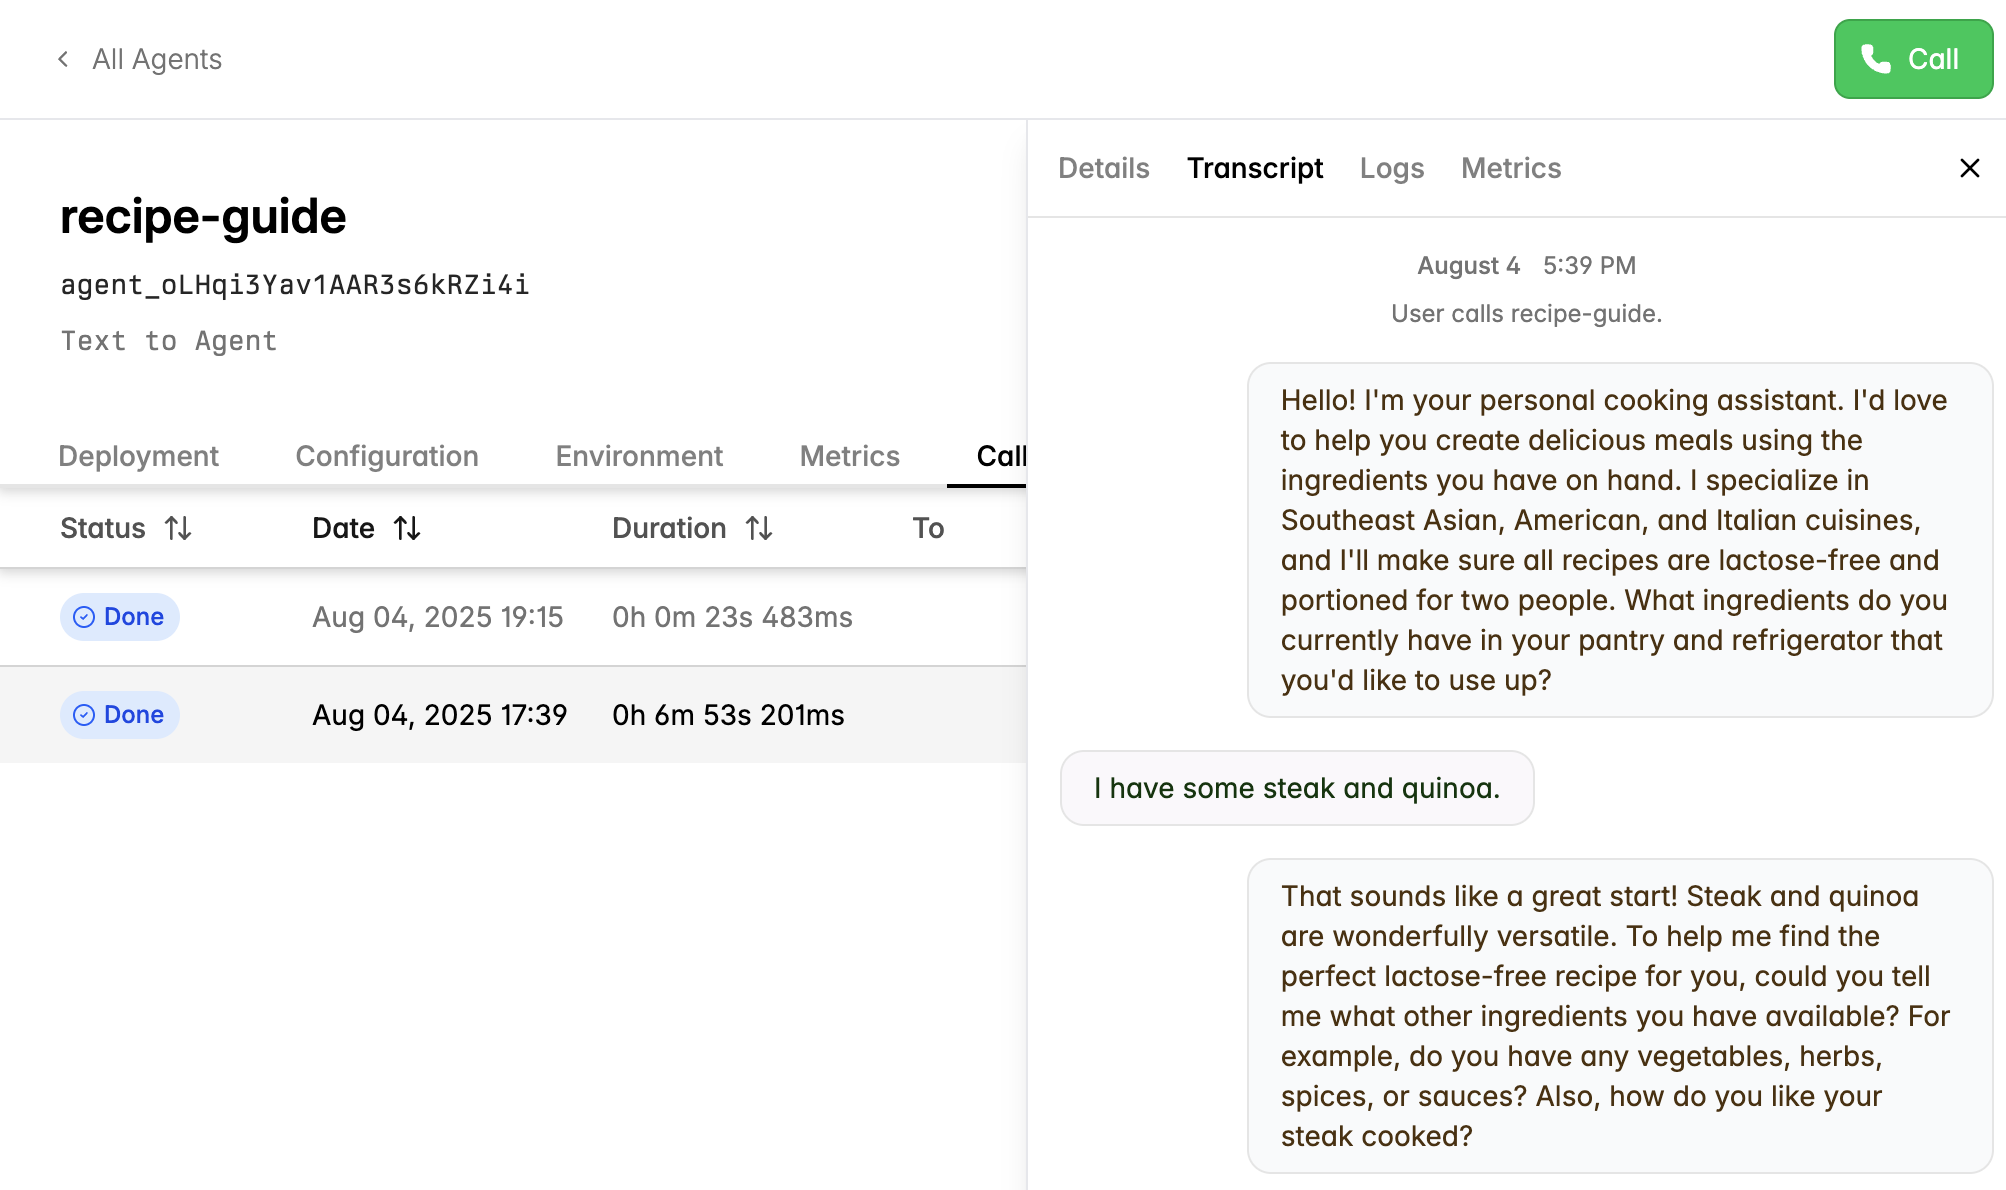
Loggable Events
Record events without tying them to tool calls.SDK
In the SDK, yieldLogMessage events from your agent or tools to record custom events:
Websocket
If you’re not using the SDK and instead just relying on the bare websocket, logging events will look like this:Playground
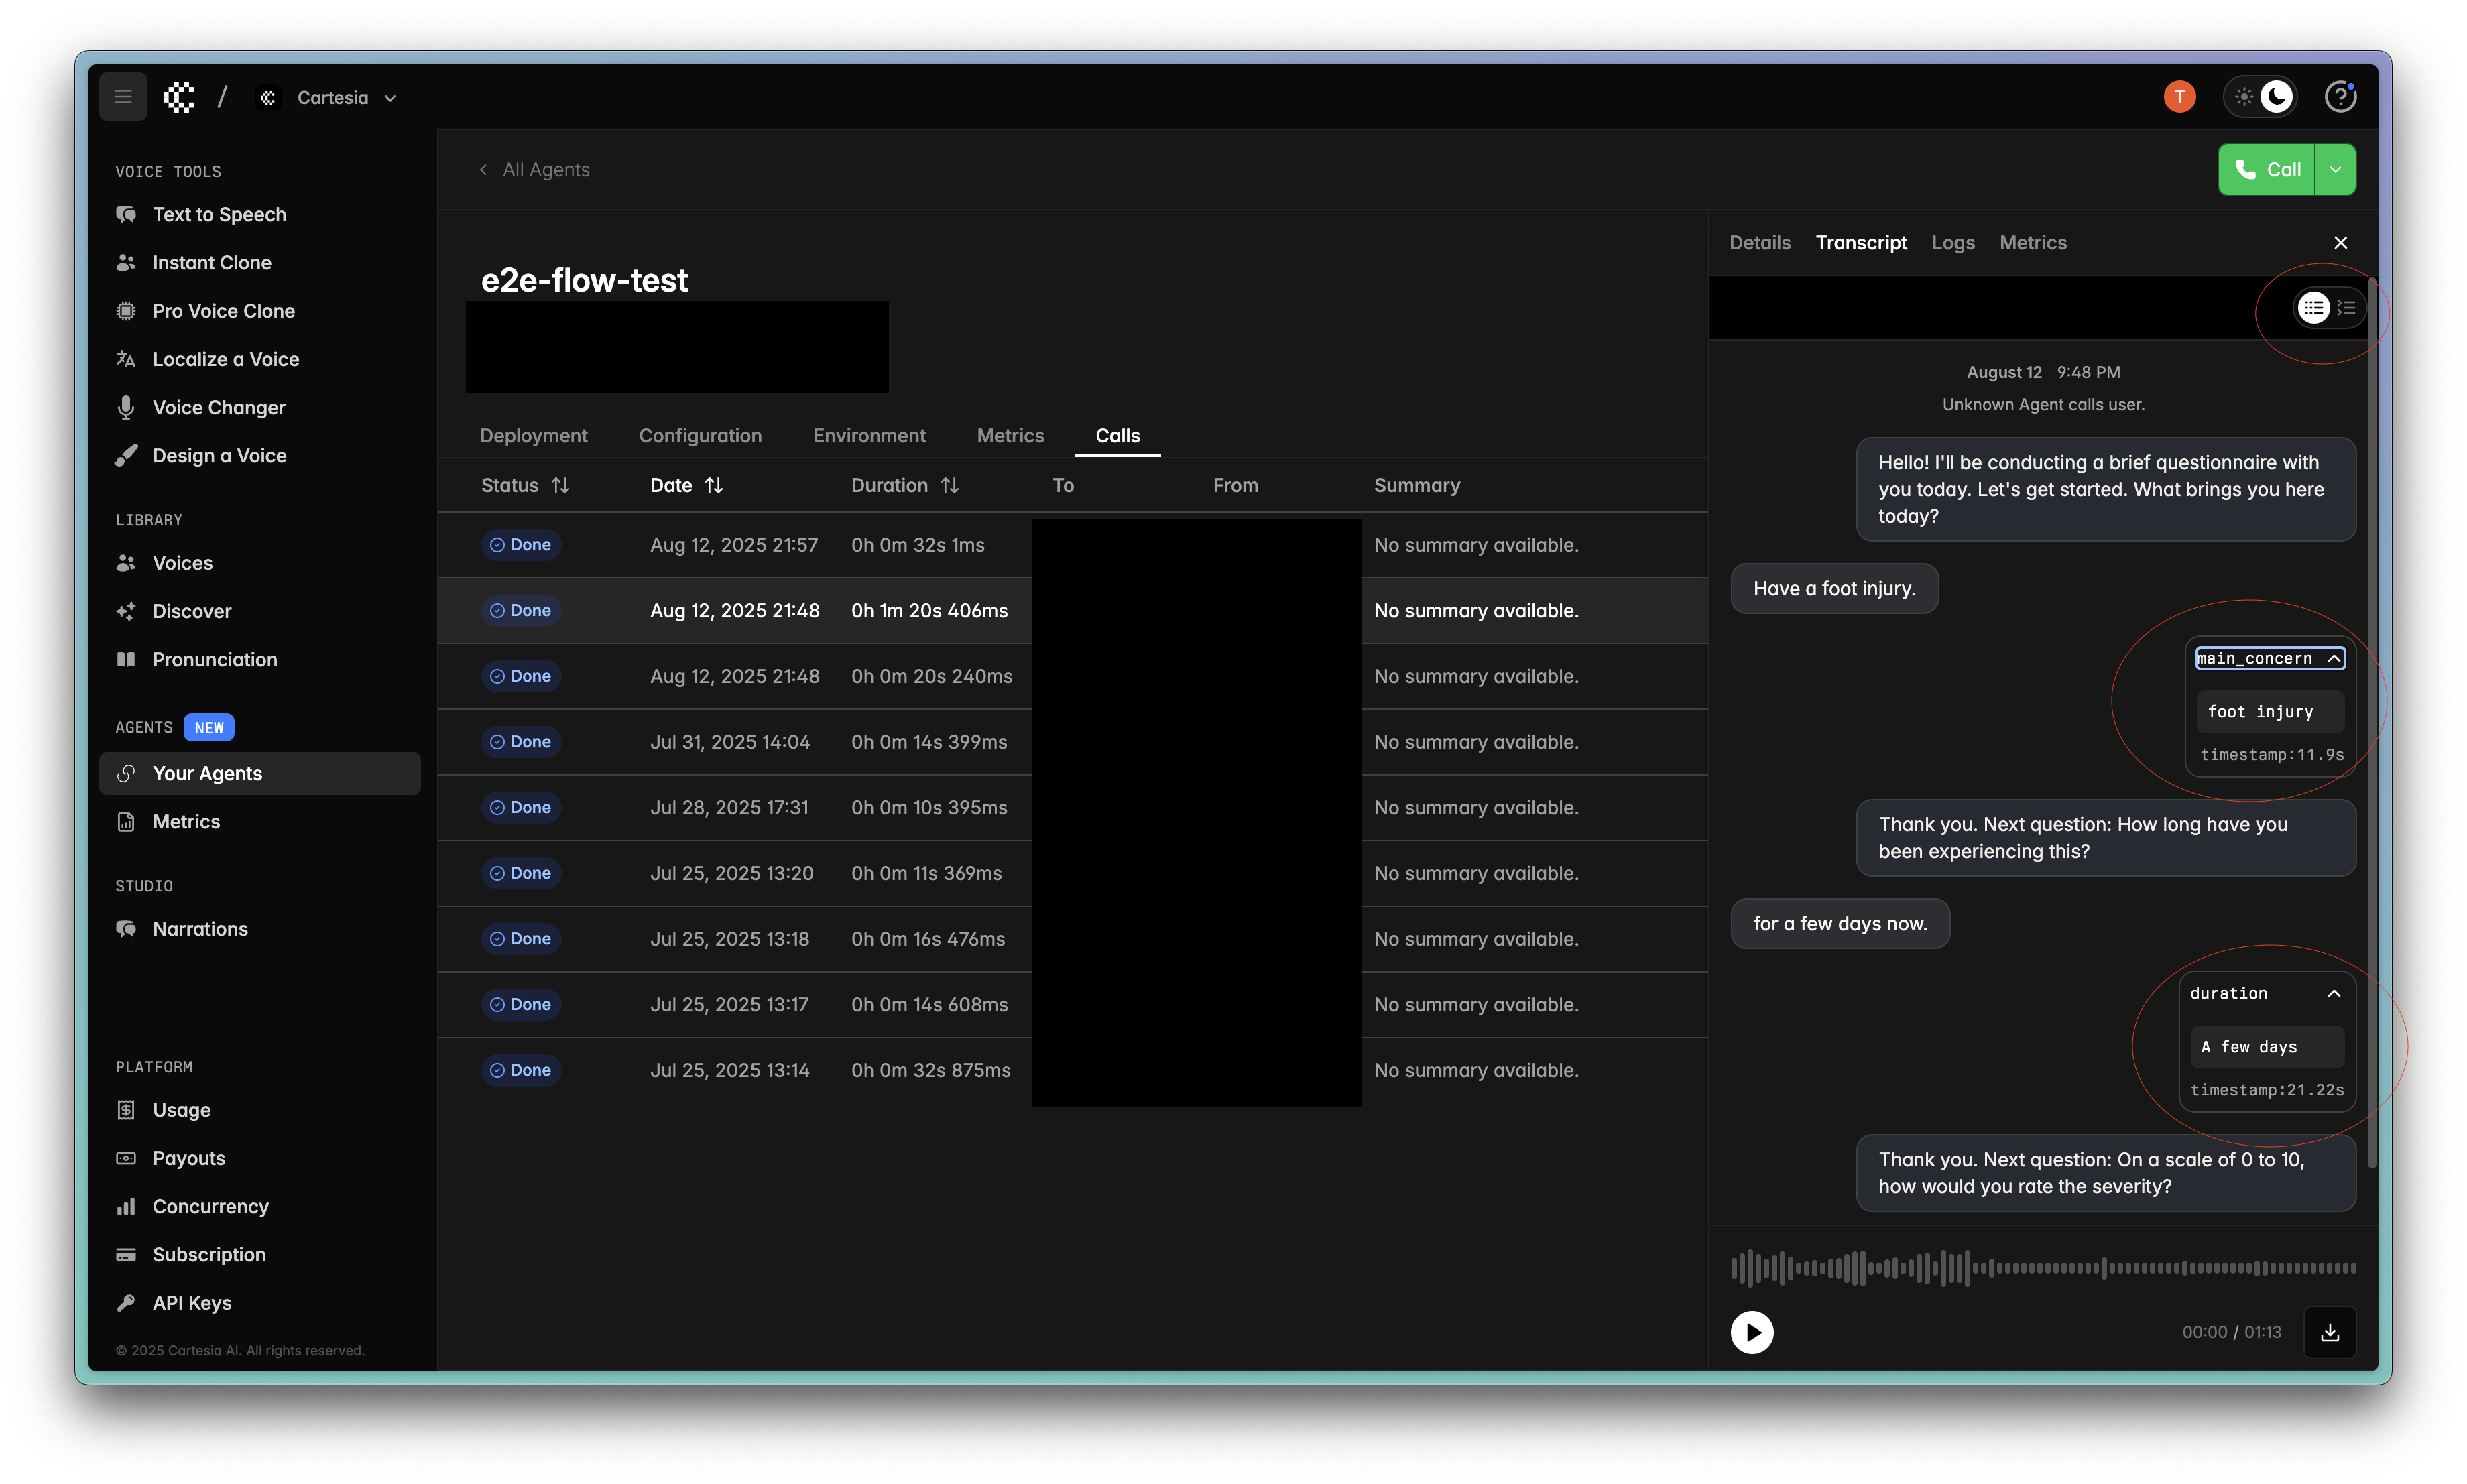
You can view these events in the Playground under theTranscript tab of the call.
Loggable Metrics
Record metrics at any point in your workflow.SDK
In the context of the SDK, we can log a metric by broadcasting theLogMetric event.
Here’s a snippet from the form filling template that exhibits this:
LogMetric event by default, and it will
log it over the websocket by default when it sees that LogMetric has been broadcast.
Websocket
If you’re not using the SDK and instead just relying on the bare websocket, logging metrics will look like this:Playground
You can view these events in the Playground under theTranscript tab of the call.
Call Recordings
Call recordings can be downloaded from the playground.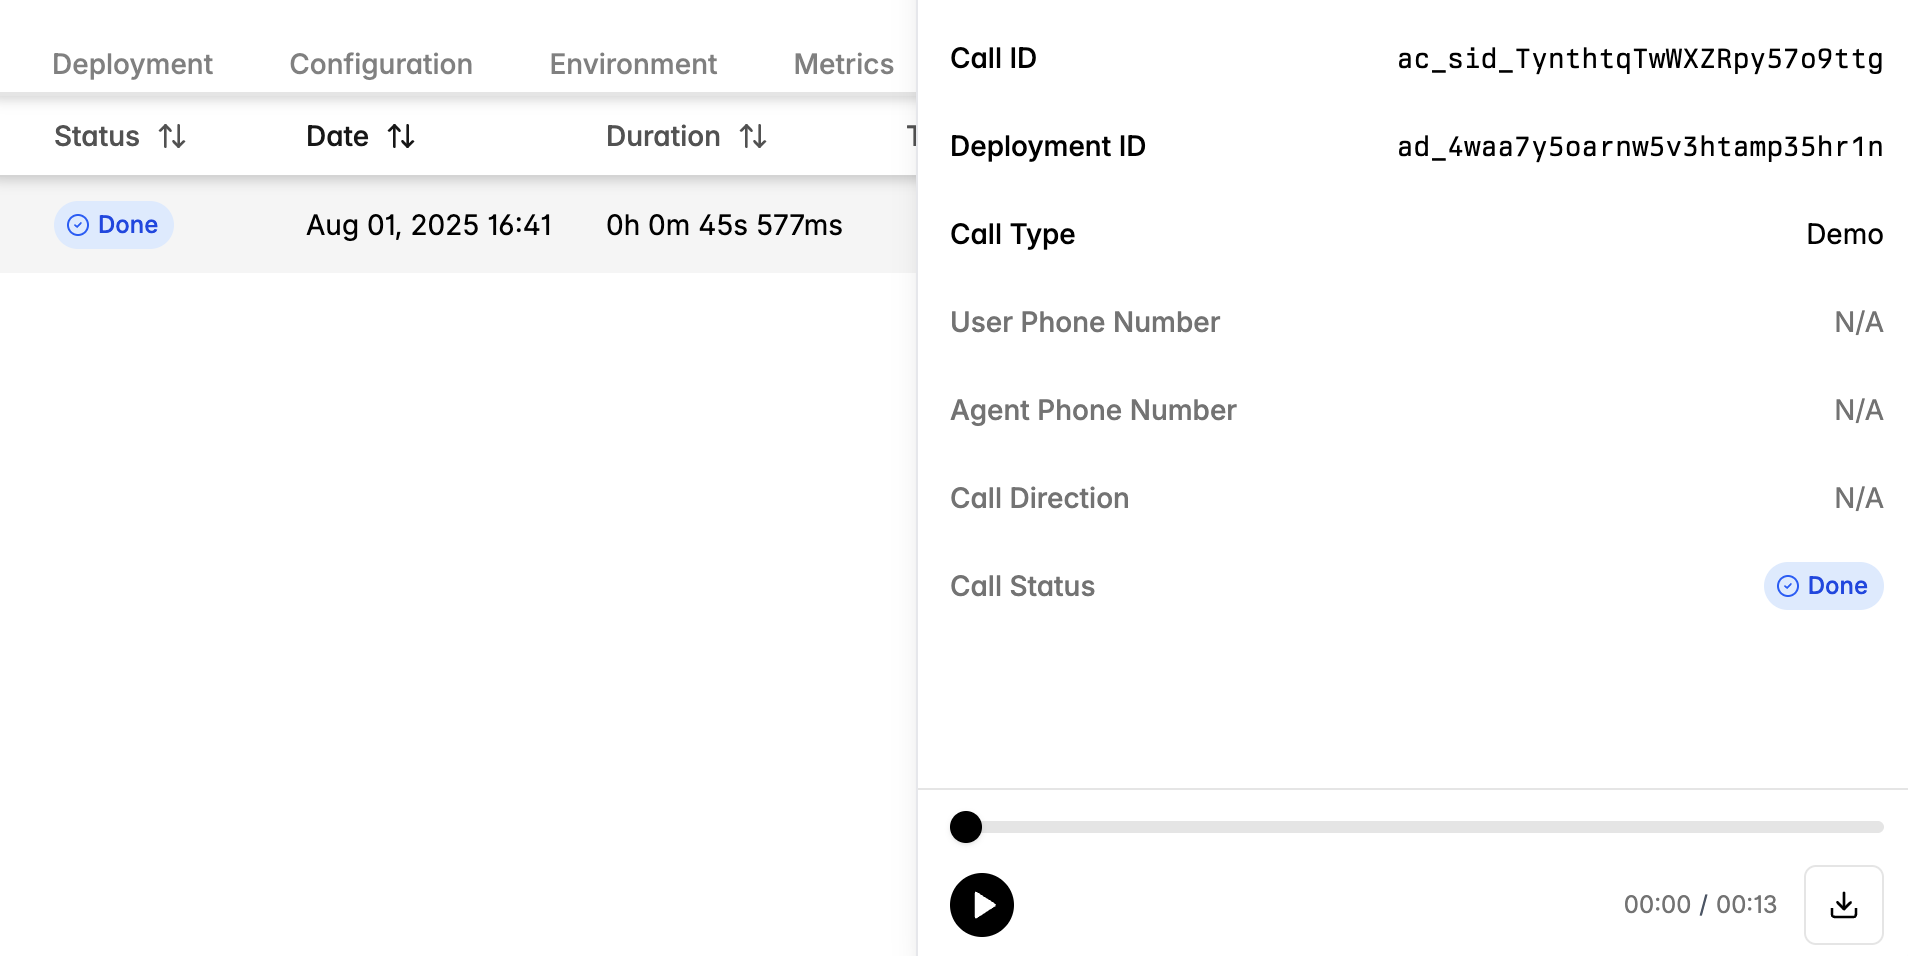
Webhooks
Cartesia sends webhook events to your HTTPS endpoint throughout the call lifecycle. ExposePOST + application/json and verify the x-webhook-secret header matches your stored secret.
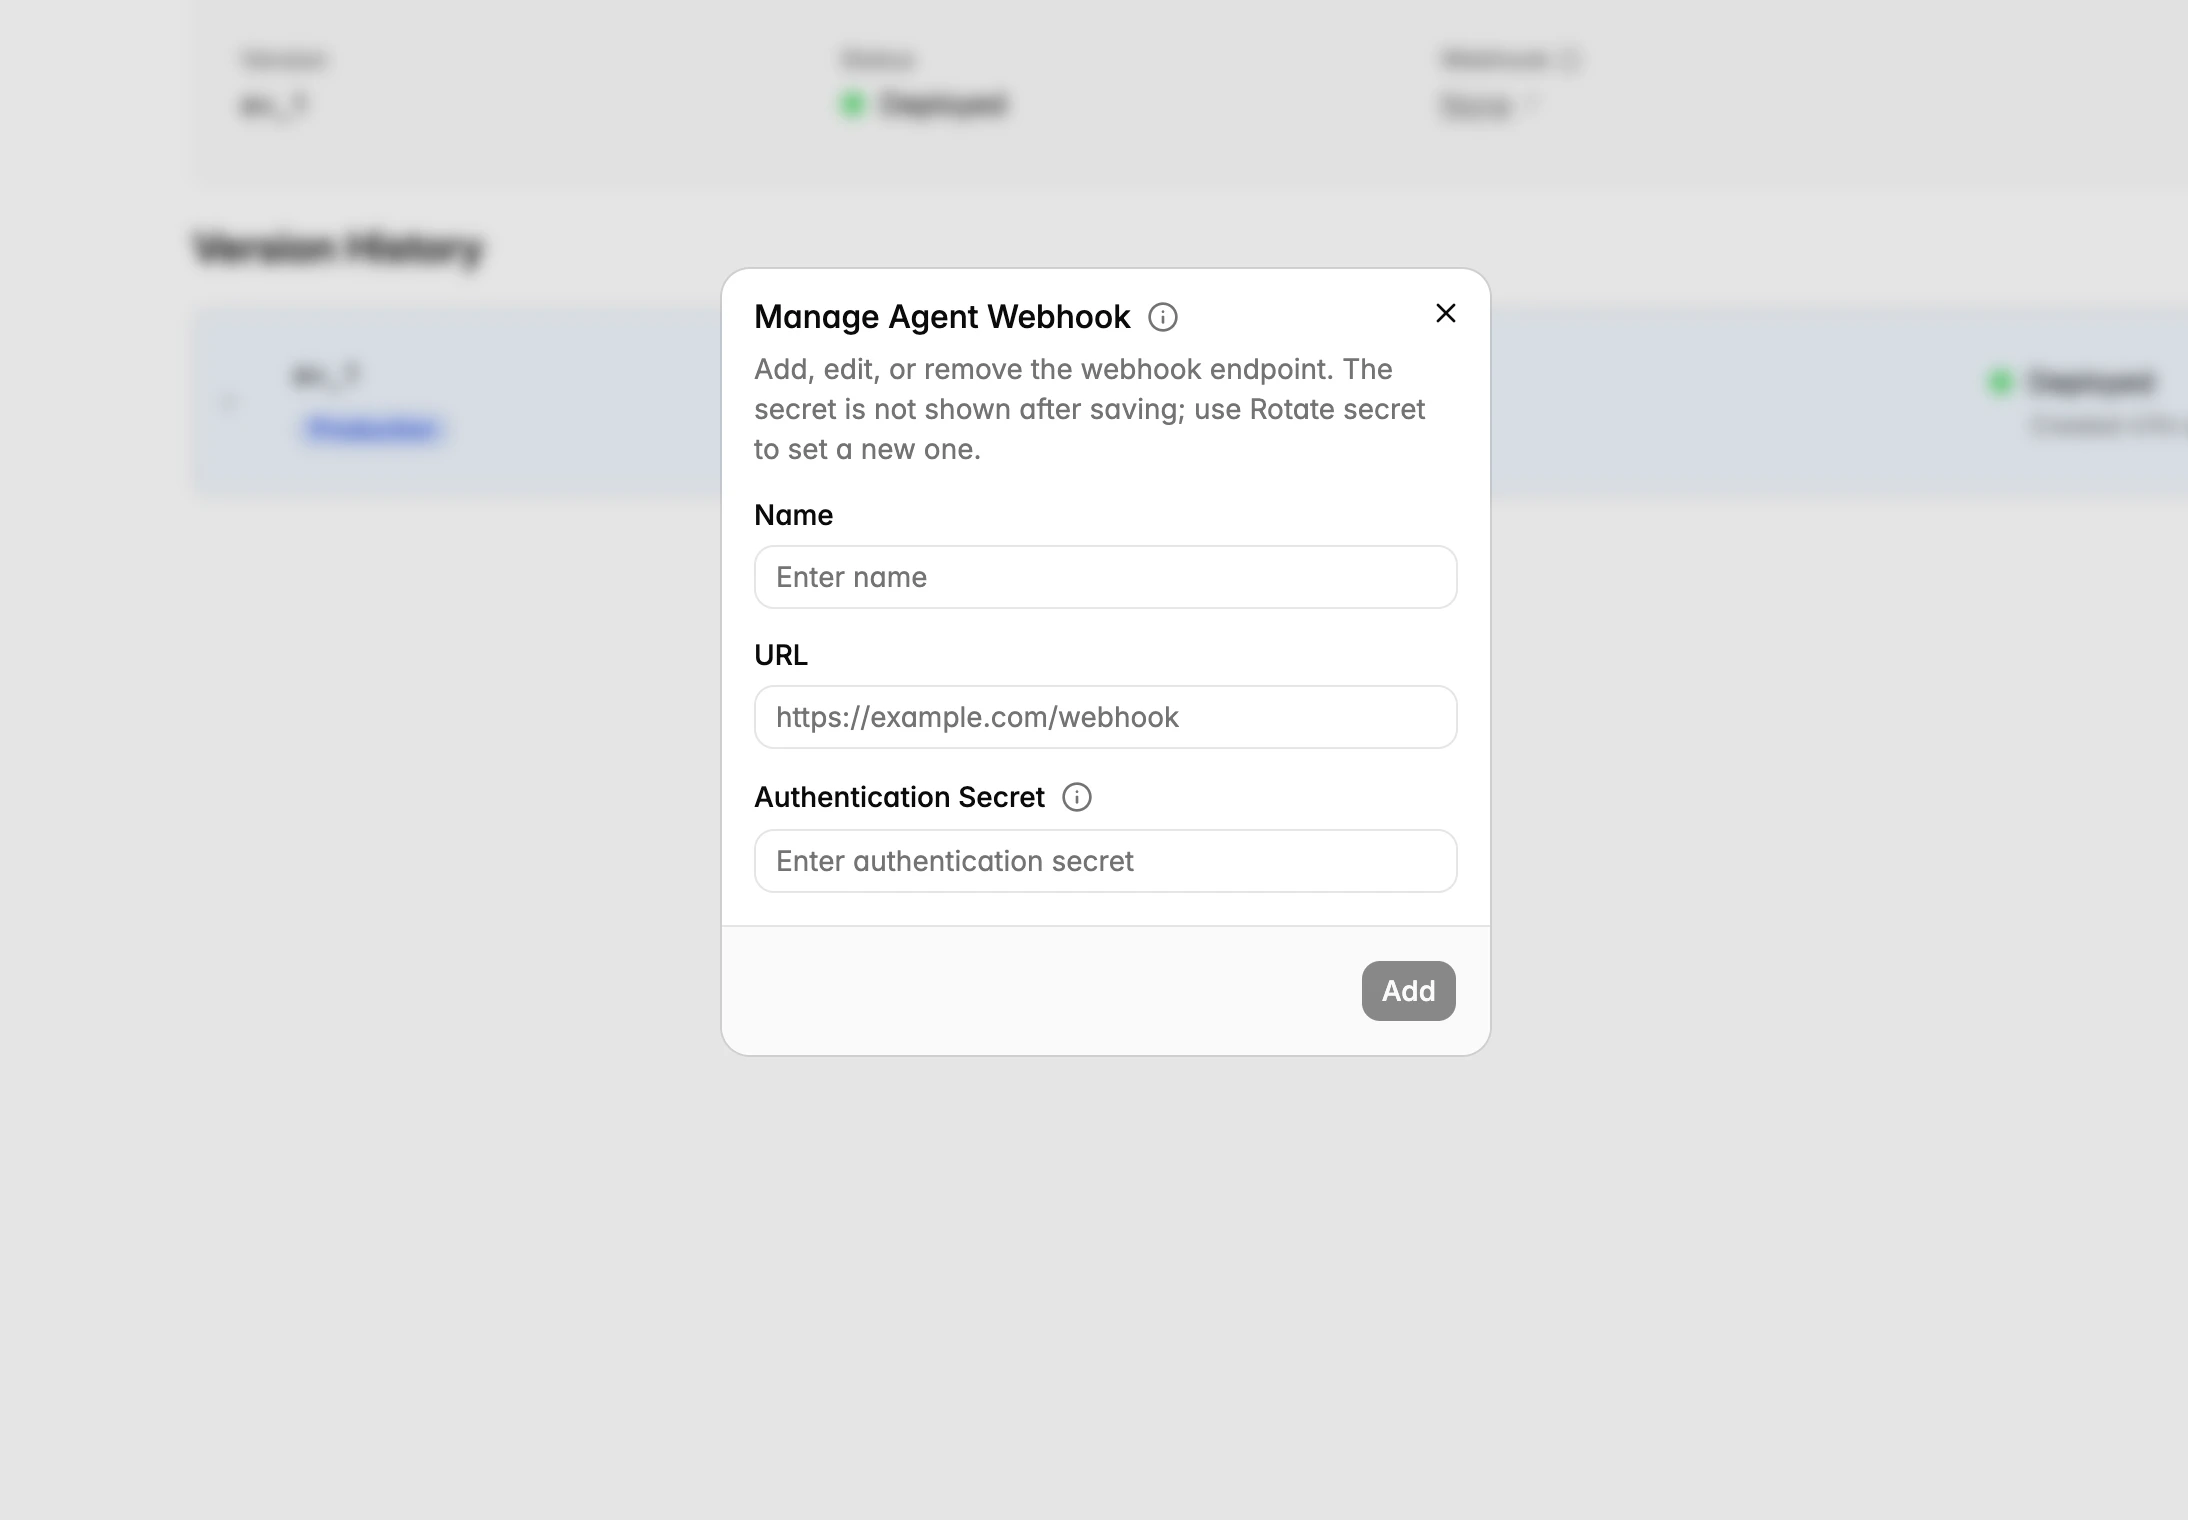
Register a webhook
Use webhooks to receive call and turn events. Attaching a webhook (URL + secret) to an agent turns on delivery for that agent’s calls, and one webhook can be attached to multiple agents.- Playground
- API
Open your agent’s Webhook settings and enter an
https URL and a secret (Cartesia returns the string in the x-webhook-secret header on every delivery so you can verify the request).Delivery retries
Cartesia attempts a webhook delivery up to 3 times when the request fails due to a network error or returns HTTP403, 408, 429, or any 5xx status. Other 4xx responses (400, 401, 404, etc.) are treated as permanent failures and aren’t retried.
Because of retries, your endpoint can receive the same event more than once. Use webhook_request_id to skip events you’ve already processed: it stays the same across every delivery attempt of one event and differs between distinct events.
Verify the webhook secret
- Python
- TypeScript
Event types
Envelope fields
Every webhook event includes these top-level fields:call
Present on call_started, call_completed, and call_failed events. Matches the GET /agents/calls/{call_id} response. Some events (e.g. call_started) may omit fields like end_time that do not yet have a valid value.
turn
Present on call_turn events. One turn per agent or user utterance.
analysis
Present on post_call_analysis events. Sent after async analysis completes (currently summary generation; evaluations and metrics will be added here in the future).
Example: call_completed
Example: post_call_analysis
Test your endpoint
For backwards compatibility:
call_completedandcall_failedevents also include a top-levelbody(transcript array) and a top-levelend_reason. Usecall.transcriptandcall.end_reasoninstead.call_turnevents also include a top-levelbodycontaining the raw turn payload. Useturninstead.